matplotlib plotting
Plotting x and y points
The plot() function is used to draw points (markers) in a diagram.
By default, the plot() function draws a line from point to point.
The function takes parameters for specifying points in the diagram.
Parameter 1 is an array containing the points on the x-axis.
Parameter 2 is an array containing the points on the y-axis.
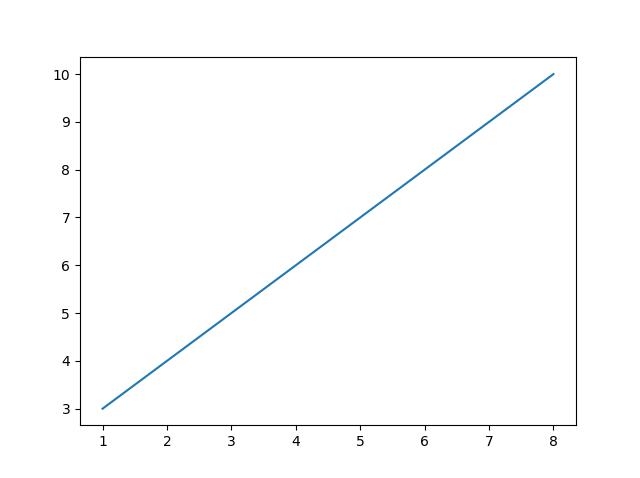
If we need to plot a line from (1, 3) to (8, 10), we have to pass two arrays [1, 8] and [3, 10] to the plot function.
Example
Draw a line in a diagram from position (1, 3) to position (8, 10):
import matplotlib.pyplot as plt
import numpy as np
xpoints = np.array([1, 8])
ypoints = np.array([3, 10])
plt.plot(xpoints, ypoints)
plt.show()
Result:
Try it Yourself »
Example
Draw a line in a diagram from position (1, 3) to position (8, 10):
Result:
The x-axis is the horizontal axis.
The y-axis is the vertical axis.
Plotting Without Line
To plot only the markers, you can use shortcut string notation parameter 'o', which means 'rings'.
Example
Draw two points in the diagram, one at position (1, 3) and one in position (8, 10):
import matplotlib.pyplot as plt
import numpy as np
xpoints = np.array([1, 8])
ypoints = np.array([3, 10])
plt.plot(xpoints, ypoints, 'o')
plt.show()
Result:
Try it Yourself »
Example
Draw two points in the diagram, one at position (1, 3) and one in position (8, 10):
Result:
You will learn more about markers in the next chapter.
Multiple Points
You can plot as many points as you like, just make sure you have the same number of points in both axis.
Example
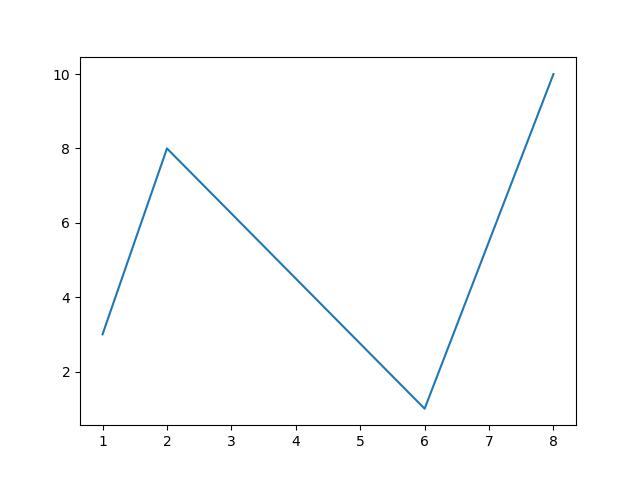
Draw a line in a diagram from position (1, 3) to (2, 8) then to (6, 1) and finally to position (8, 10):
import matplotlib.pyplot as plt
import numpy as np
xpoints = np.array([1, 2, 6, 8])
ypoints = np.array([3, 8, 1, 10])
plt.plot(xpoints, ypoints)
plt.show()
Result:
Try it Yourself »
Example
Draw a line in a diagram from position (1, 3) to (2, 8) then to (6, 1) and finally to position (8, 10):
Result:
Default X-Points
If we do not specify the points in the x-axis, they will get the default values 0, 1, 2, 3, (etc. depending on the length of the y-points.
So, if we take the same example as above, and leave out the x-points, the diagram will look like this:
Example
Plotting without x-points:
import matplotlib.pyplot as plt
import numpy as np
ypoints = np.array([3, 8, 1, 10, 5, 7])
plt.plot(ypoints)
plt.show()
Result:
Try it Yourself »
Example
Plotting without x-points:
Result:
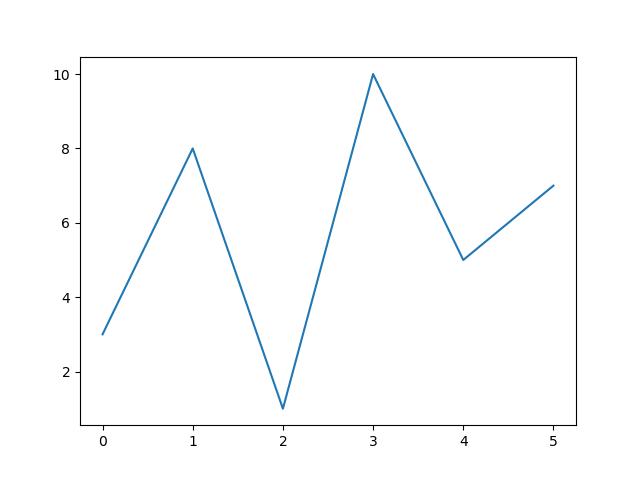
The x-points in the example above is [0, 1, 2, 3, 4, 5].
Popular information


Popular articles


Latest articles